Legacy to Modern: Bridging Trace Flows with Dual-Writing and Alloy
After Phase 1, the Insurance Hub had a stable Kubernetes runtime and a GitOps delivery loop in the QA K3s environment. Deployments were now repeatable and the cluster could be reconciled from Git, but cross-service troubleshooting was still constrained by the legacy tracing setup.
Zipkin was operational, but it remained an isolated backend tied to legacy storage paths. This limitation becomes critical as we approach Phase 4, where requests will routinely cross the boundary between Java and Go services. During this hybrid period, traces must land in one place; otherwise, investigations degrade into stitching together partial views across incompatible tools.
Phase 2 directly addresses this constraint by establishing Grafana Tempo as the primary tracing backend early on, without modifying existing Java services. I introduced Grafana Alloy as a telemetry gateway to dual-write traces to both Zipkin and Tempo, while also deploying Loki and validating the logging path via direct HTTP push to ensure the stack is ready for future service rewrites.
Phase 2 Scoping: Establishing Observability Foundation
Phase 2 was designed as a strategic bridge between the initial Kubernetes migration and the forthcoming service rewrites. The primary objective was to modernize the telemetry backend while keeping the Java services unchanged. By establishing a robust tracing and logging foundation early on, I ensured that the hybrid environment—where legacy Java services and new Go services will eventually coexist—would have a single trace store and Grafana Explore workflows that work across legacy and Go services.
The development work was managed through a dedicated Epic in GitHub Projects, divided into four targeted tickets. Success for this phase meant achieving stable dual-writing for traces and ensuring that the entire observability installation was repeatable through refined QA provisioning.
| Ticket | Deliverable | Description |
|---|---|---|
| #80 | Grafana Loki Installation | Deploy Loki in the QA cluster with MinIO-backed storage to serve as the future target for centralized log aggregation. |
| #81 | Grafana Tempo Installation | Set up Tempo as the primary tracing store, providing a scalable, S3-compatible alternative to the legacy Zipkin backend. |
| #82 | Grafana Alloy Deployment | Implement Alloy as a permanent telemetry gateway to ingest legacy traces and route them into the modern stack. |
| #86 | QA Cluster Provisioning Refinement | Update Make targets and infrastructure automation to handle the increased resource footprints of the observability components. |
In this phase, the focus was primarily on infrastructure. I regarded the installation of Loki and Tempo as essential for the long-term health of the platform, ensuring that our storage strategy remained aligned with the MinIO-based approach established in Phase 1. The introduction of Grafana Alloy allowed me to validate the end-to-end trace flow from existing Java services into Tempo, effectively strengthening the observability pipeline even before any Go code was written. This proactive setup minimizes operational risks in Phase 4, as the monitoring environment is already mature and ready to receive OTLP signals.
Gateway Pivot: Decoupling Tracing with Grafana Alloy
Initially, my plan for Phase 2 was to use a standard OpenTelemetry Collector as a temporary bridge, intending to decommission it once our new Go services could send traces directly to Tempo. However, after researching OpenTelemetry best practices and the architectural requirements for a multi-language cluster, I decided to switch to Grafana Alloy as the permanent telemetry gateway.
This decision was a strategic pivot rather than just a preference for different tools. The core issue wasn’t solely Zipkin; it was that our telemetry pipeline was tightly coupled to specific backends. By implementing Alloy as a permanent infrastructure layer, I’ve established what I refer to as a “permanent contract” for the cluster. Alloy provides stable, cluster-wide endpoints for both legacy Zipkin traffic and modern OTLP signals. This allows us to evolve our backend storage from Zipkin to Tempo without needing to modify the service-level instrumentation again. Additionally, since our entire modern stack is centered around Grafana, Alloy acts as the native connector that ensures seamless correlation between logs, metrics, and traces within the same ecosystem.
Trace Flow Transition: The Dual-Write Strategy
During this phase, the architecture of our trace flow experienced a major transformation. In the legacy state, services communicated directly with the Zipkin backend. In the new Phase 2 state, Alloy takes center stage, functioning as a traffic controller for the flow of information.
Flow Transition: From Legacy to Target State
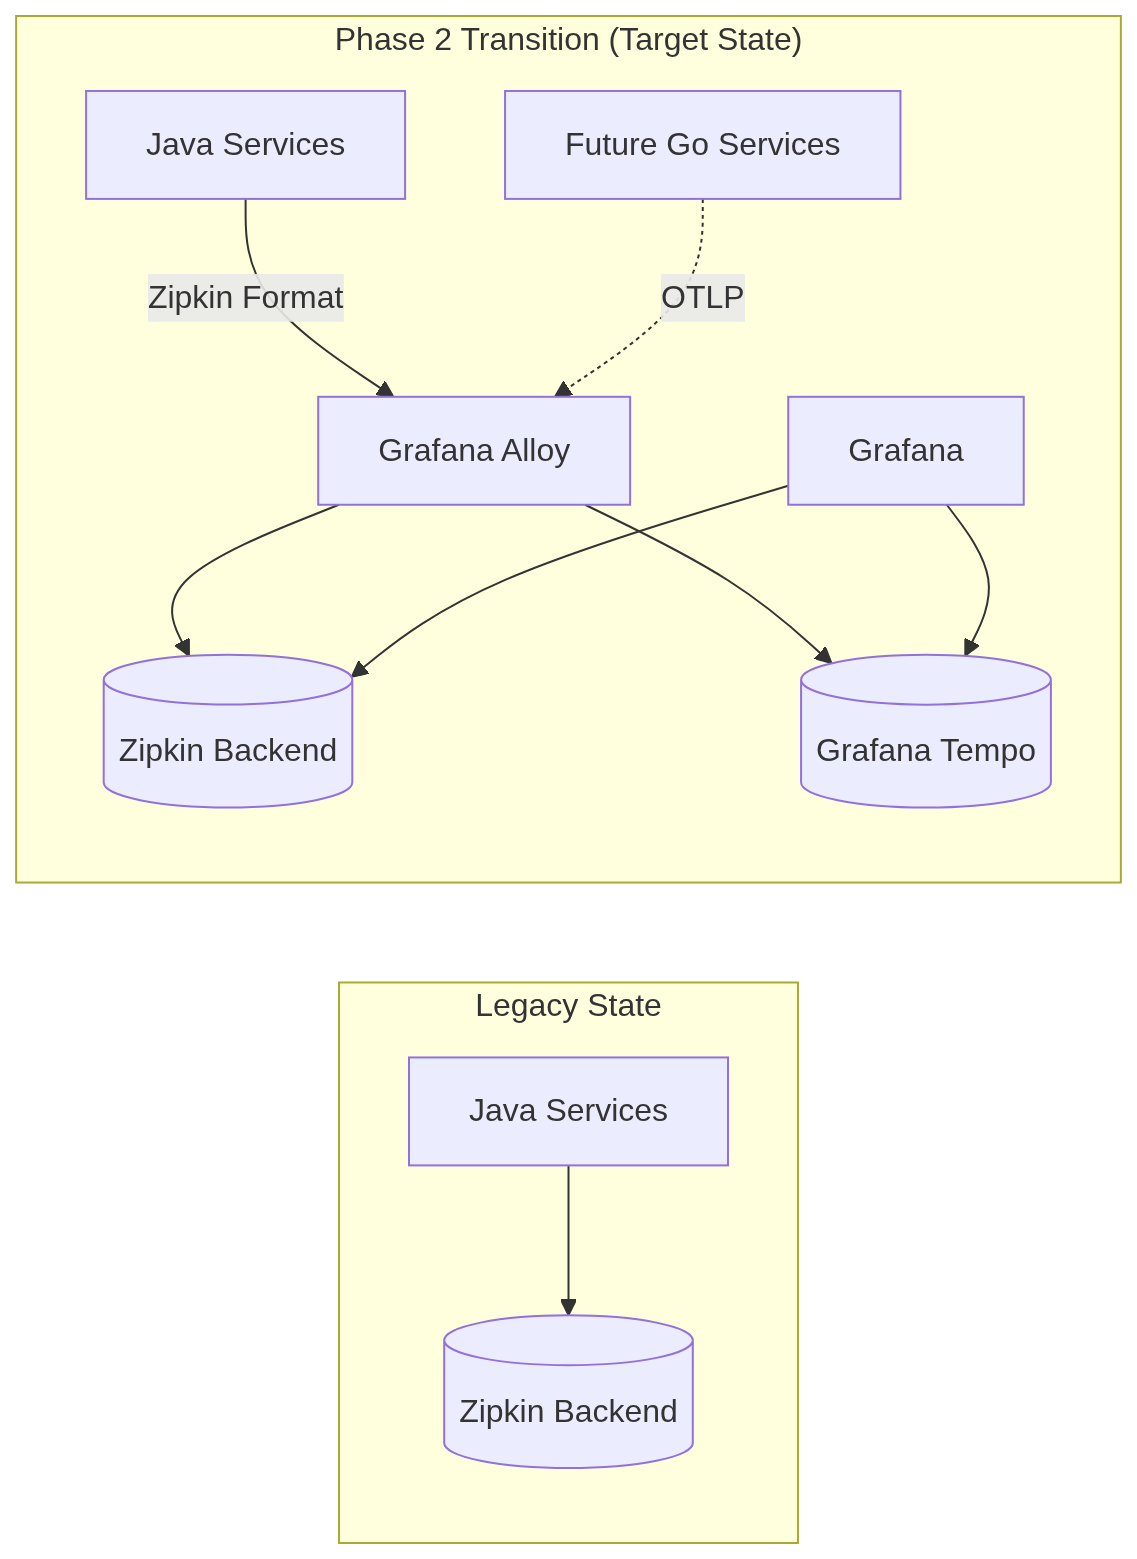
I chose to implement a dual-write strategy in which Alloy forwards traces to both Zipkin and Tempo simultaneously. This approach was justified despite the added complexity for three main reasons:
- Reduced Cutover Risk: Zipkin remains the primary safety net. If Tempo or the MinIO backing store struggles under load, the existing debugging workflow remains untouched. This reduces the blast radius of the transition at the cost of temporary additional ingestion overhead.
- Span Validation: We can compare the same traces in the legacy Zipkin UI and the new Grafana-first Tempo dashboards. This allows us to ensure that span counts, service names, and critical attributes survive the Zipkin-to-Tempo ingestion path.
- Clean Flip: This setup offers a straightforward path for decommissioning. Once we are confident in Tempo’s retention and performance, we can simply remove the Zipkin exporter from the Alloy configuration. This change can be made without service restarts or code modifications.
This transition effectively decouples our telemetry “producers” from the “consumers,” transforming observability from a hard-coded dependency into a manageable infrastructure service.
Grafana-centered Observability: Implementing Logging and Tracing
With the dual-write strategy defined, the remaining Phase 2 work involved standing up the storage backends (Tempo first, Loki staged) and then deploying Grafana Alloy to tie the pipeline together. Making this installation repeatable across the QA K3s environment was a primary focus.
Loki
The legacy Java services do not have any centralized logging capabilities, resulting in fragmented console output that requires manual, ad-hoc aggregation. As we transition these services to Go, I have prioritized establishing a robust logging foundation. Given our Grafana-centered stack, Loki was the logical choice for log aggregation. It follows the same label-based indexing philosophy as Prometheus, avoiding the high resource overhead associated with full-text indexing while providing the query performance necessary for rapid incident response.
The deployment utilizes a dedicated MinIO tenant for Loki, provisioned through our established operator patterns to ensure that log storage is both isolated and scalable. I integrated Loki into the QA cluster using a streamlined set of Make targets to manage its lifecycle:
loki-install– Deploy Grafana Loki via Helm chart into theqa-monitoringnamespace.loki-status– Check status of Loki pods and services.loki-ui– Port-forward UI/API for direct querying and troubleshooting.loki-uninstall– Uninstall the Loki deployment from the cluster.
To ensure the persistence layer is reliable, I wrote “Verify Loki Logs” runbook to validate that logs can be pushed and stored as objects in the loki-logs MinIO bucket. While I validated the storage path and basic queryability via direct OTLP/HTTP push, I have deferred cluster-wide collection pipelines and dashboard tuning until Phase 4. This verification confirms that our logging infrastructure is operationally usable and ready for future workload integration.
Tempo
The legacy Java environment uses Zipkin for distributed tracing, storing spans in Elasticsearch. While this setup provides basic visibility, it operates as a silo, making it challenging to correlate with our emerging metrics and logs. To unify our observability data, we have integrated Tempo as our new high-scale trace storage backend. Tempo is designed to store large volumes of trace data cost-effectively by utilizing object storage, which aligns perfectly with our transition to S3-compatible persistence.
Similar to our logging system, Tempo is deployed with a dedicated MinIO tenant to ensure storage isolation and independent scaling. I have added several Make targets to the QA cluster configuration to automate the deployment:
tempo-install– Deploy Grafana Tempo via Helm chart into theqa-monitoringnamespace.tempo-status– Check status of Tempo pods and associated services.tempo-ui– Port-forward UI/API for troubleshooting and direct trace retrieval.tempo-uninstall– Uninstall Tempo resources from the cluster.
To validate the integration, I created a technical runbook that demonstrates the complete trace flow. This process involves sending synthetic spans via OTLP/HTTP—a method I chose for its minimal dependencies—and confirming their presence in the tempo-traces MinIO bucket and the Grafana UI. The full verification steps, documented in “Verify Tempo Traces,” ensure that our tracing pipeline is ready to ingest data from both legacy systems and future Go services.
Alloy
With Loki and Tempo serving as our storage backends, the final requirement for Phase 2 was a unified telemetry collector. Alloy acts as the critical bridge between our legacy Java services and the modern observability stack, handling the ingestion, processing, and routing of all telemetry signals from a single agent.
I deployed Alloy as a central service in the qa-monitoring namespace, configured with specific receivers for Zipkin spans and OTLP data. This consolidation removes the need to handle multiple disparate collectors, simplifying our infrastructure footprint. I also introduced standard Make targets to manage Alloy’s lifecycle:
alloy-install– Deploy Grafana Alloy via Helm chart with our custom pipelines.alloy-status– Check status of the Alloy pods and ingestion services.alloy-ui– Port-forward UI for real-time pipeline debugging and component inspection.alloy-uninstall– Uninstall the Alloy agent from the monitoring namespace.
To verify the integrity of the pipeline, I developed “Verify Alloy Traces” runbook that tests the end-to-end flow of traces through the collector. By sending spans to Alloy’s receivers and monitoring their successful propagation to Tempo, we ensure that our telemetry system is correctly configured. This setup gives us the confidence to proceed with the full service migration, knowing that our observability bridge is stable and production-ready.
QA Cluster: Stabilizing Infrastructure Bootstraps
Throughout Phase 2, the reliability of our QA environment became a primary focus as we automated the deployment of the complete observability stack. Establishing these pillars made existing race conditions visible; fixing them required making the bootstrap process deterministic. Transitioning from manual installations to codified Make targets, I encountered a persistent issue: CRD-based stacks like CloudNativePG and Strimzi often failed in subtle, non-deterministic ways. These failures typically occurred when the Kubernetes API server had not yet fully registered a Custom Resource Definition (CRD) before a dependent Custom Resource (CR) was applied.
Initially, these race conditions manifested as flaky automation results or false negatives. After testing various sequencing methods, I concluded that simply layering Helm charts or Kustomize manifests was inadequate. A successful deployment requires waiting until the CRDs are explicitly in an Established state and ready for use. This ensures that the control plane can validate and persist subsequent resources without encountering transient errors that disrupt the GitOps flow.
I refactored the infrastructure deployment targets to include explicit readiness checks using kubectl wait and iterative status polling. For instance, when deploying the CloudNativePG operator, the automation now pauses until the operator’s CRD is established. We then poll to ensure that the API server positively responds to a get request for that resource type. This shift from a “fire and forget” approach to a deterministic readiness strategy has stabilized our bootstrap process, making observability installations repeatable across multiple cluster teardowns.
Additionally, I simplified the physical topology of the QA environment by introducing an optional single-node QA profile for faster iteration. The primary reason for this change was to accelerate the testing of new cluster provisioning modifications by reducing the overhead of managing multiple LXD containers. By removing default taints from the control-plane node (qa-master) to allow workload scheduling, I created a more efficient and responsive environment for our Phase 2 validation without sacrificing the integrity of the multi-namespace monitoring stack.
AI Usage: Transitioning to Spec-First Engineering
A quick aside on process: my use of AI tools has evolved as the technical complexity increased. In the opening of this series, I committed to using these tools as high-speed technical references rather than generic code generators. During Phase 2, this approach matured into a specification-first, agent-based methodology.
Initially, I used AI primarily for fragmented, chat-based queries. However, after experimenting with more structured workflows, I began aligning prompts directly with GitHub tickets and explicit acceptance criteria. By providing the model with the technical context of the current environment—such as existing Make targets and Kubernetes namespace conventions—I have been able to maintain a consistent development pace while keeping the architectural direction firmly under my control. This agentic workflow is still a work in progress, and I will provide a final analysis once the Go migration patterns are fully finalized.
Phase 2 Completion: Trace Cutover Safety Net
Phase 2 concludes with a significantly improved observability foundation, transforming the distributed system into a transparent and queryable environment. Operationally, we have achieved stable dual-writing to both Zipkin and Tempo via Grafana Alloy, established a scalable trace store, and secured a deterministic QA bootstrap process. While cluster-wide log ingestion is intentionally deferred, the storage path for Loki is validated and ready for future service rewrites.
This observability stack serves as a critical safety layer for the upcoming technical transitions. As we move into Phase 3 to consolidate our data stores, we will rely on these telemetry signals to monitor the integrity of our ETL scripts and the performance of our new PostgreSQL JSONB schemas. By migrating our product data away from MongoDB now, we reduce operational complexity before starting the high-risk language migration to Go. With full trace visibility in place, we can execute these database refactors with confidence, knowing that any regressions in inter-service communication or data latency will be immediately visible.
Continue reading the series “Insurance Hub: The Way to Go”:
- From Java to Go: Kicking Off the Insurance Hub Transformation
- From Docker Compose to Kubernetes: Lifting the Insurance Hub into the Cloud
- Lift Completed, Now Shift: Making the Insurance Hub Kubernetes-Native (Enough)
- From Push to Pull: Completing Insurance Hub Phase 1 with CI/CD and GitOps
- Legacy to Modern: Bridging Trace Flows with Dual-Writing and Alloy