From Docker Compose to Kubernetes: Lifting the Insurance Hub into the Cloud
In the inaugural post of the “Insurance Hub: The Way to Go” series, I unveiled my ambitious strategy: modernizing a Java-based insurance system into a cloud-native Go application. With that roadmap firmly in place, the past two months have been dedicated to hands-on engineering, transitioning the vision from architectural diagrams to tangible implementation. This article chronicles the execution of Phase 1—a foundational “lift and shift” that establishes our new cloud environment.
This phase involves migrating the entire legacy application from the familiar confines of Docker Compose into a robust, production-like Kubernetes environment. By establishing parallel clusters—using Kind for local development and K3s for production-like QA—this critical first step, which I think of as the metaphorical “lift,” validates our new platform and lays the stable groundwork necessary for the upcoming, deeper service-by-service “shift” migration.
In this installment, I’ll guide you through the foundational infrastructure “lift” phase of migrating the Insurance Hub to Kubernetes, specifically covering:
- Provisioning local development and QA Kubernetes clusters using Kind and Rancher’s K3s, creating production-like environments for thorough testing and validation.
- Deploying core cluster observability tools, including Prometheus and Grafana for metrics and monitoring, alongside Zipkin for distributed tracing of Insurance Hub services.
- Installing essential infrastructure components for the Insurance Hub, such as PostgreSQL, MongoDB, Elasticsearch, and Apache Kafka. I’ll also introduce MinIO as the new S3-compatible object storage solution, replacing the existing filesystem.
- Deploying auxiliary services like JSReport to support the Insurance Hub’s PDF generation capabilities, ensuring all legacy functionalities remain operational.
This second article in the series focuses on establishing our cloud-native platform foundation by replicating the existing environment within Kubernetes. Specific Java service modifications and gateway deployments are reserved for the next “shift” phase, ensuring this initial “lift” prioritizes minimal disruption while validating stable operation on our new Kubernetes infrastructure.
Project Backlog: Refining Migration Scope
Before diving into Phase 1, a thorough review and adjustment of its scope were crucial for ensuring a smooth and effective migration. This involved extensive research into best practices for both local development and production-like Kubernetes environments. I quickly realized that observability needed to extend beyond just Insurance Hub services to encompass the underlying infrastructure components, providing comprehensive monitoring and troubleshooting capabilities. During this review, I recognized that I had completely missed deploying Zipkin for distributed tracing and JSReport for PDF generation. As a result, both were added to our scope. Furthermore, integrating GitOps early in the migration process was deemed essential for maintaining consistency and automation, prompting its migration from Phase 6 to Phase 1.
Once the scope was refined, I created the initial epic ticket for Phase 1 in the “Insurance Hub - Go Migration” project, followed by more granular tickets aligned with our expanded scope. To streamline this process, I leveraged the Junie AI coding agent to assist in drafting detailed descriptions based on a standardized template. For managing the workflow, all new tickets initially enter the “Backlog” column and must undergo a refinement process before being moved to “Ready.” This process involves validating ticket descriptions and acceptance criteria, conducting necessary research—such as, for example, evaluating whether to use ArgoCD or Flux for GitOps—and updating the “Dev Notes” section. This structured approach ensures clear communication, proper preparation, and prioritization, laying a strong foundation for executing the lift phase of our migration.
Cluster Provisioning: Establishing Local Dev and QA Environments
Since the Kubernetes cluster forms the very foundation of this entire migration, I meticulously evaluated available tools and options to find a solution that balances resource efficiency with the capability to handle complex networking, storage, and production-like workloads. My goal was to host a distributed system comprising eight Java/Go microservices, along with stateful components and a full suite of observability tools.
Given my extensive experience using Kind-based Kubernetes clusters for local development in my professional life, it was an obvious choice to leverage Kind again for the Insurance Hub’s local development environment.
For the production-like QA environment, I weighed two primary options: utilizing a managed Kubernetes service from a well-known cloud provider or setting up a local, fully compliant (or very nearly compliant) Kubernetes environment. I ultimately opted for the latter, driven by several factors: it allowed me to eliminate cloud infrastructure costs by utilizing my existing hardware (which has ample CPU and RAM), gain complete administrative control for deep customization, and acquire invaluable hands-on experience managing a production-like cluster, thereby deepening my Kubernetes expertise.
Initially, I selected MicroK8s for this production-like simulation, as it offers a complete, conformant Kubernetes environment with many built-in add-ons for common functionalities. However, deploying and configuring MicroK8s proved to be more resource-intensive and time-consuming than anticipated.
After further research and testing, I switched to Rancher’s K3s. While K3s is not 100% fully conformant with Kubernetes, it is remarkably close and ideally suited for simulating a production environment locally without excessive resource consumption or an overly complex setup. K3s strikes an excellent balance between providing a full-fledged Kubernetes experience and maintaining development machine efficiency.
Since Make is widely used in Go projects, I chose to leverage it
extensively for automating and reliably reproducing every step involved in creating clusters and
deploying both infrastructure and service components. To maintain consistency and readability while
relying on Makefiles, I added a dedicated style
guide section
to the CONTRIBUTING.md file, outlining the best practices for using Make within the project.
Additionally, the Prerequisites section was added to clearly document all required dependencies. This ensures that everything is provided from the developer’s perspective for smooth development and proper operation of the Insurance Hub within a Kubernetes cluster. Before proceeding with creating clusters, all necessary dependencies should be installed and configured correctly. To facilitate this process, I created a helper Makefile target named prereq-k8s-all that automates this setup along with the prereq-data-all target to install all required data infrastructure dependencies.
Local Dev
Setting up a Kind cluster is straightforward and fast, making it ideal for the iterative development of the Insurance Hub’s eight Java/Go microservices and accompanying infrastructure. To make cluster operations repeatable and error-free, I created several Makefile targets:
local-dev-create- Creates and starts a single-node Kind cluster.local-dev-delete- Stops and removes the cluster and its persistent storage.local-dev-suspend- Stops the cluster without deleting it.local-dev-resume- Starts the suspended cluster again.
All steps required to create and manage the Kind cluster are meticulously documented in the “Local Dev” section of the “Base Cluster How-To’s” guide.
Production-like QA
To ensure the QA environment closely mirrors a production setup, I opted to use LXD-based virtual machines as cluster nodes instead of Docker containers. Canonical’s LXD provides stronger isolation and better compatibility with production-like environments, all while remaining lightweight enough for local development.
My development machine is equipped with 24 logical CPUs (16 physical cores) and 64 GB of RAM. Recognizing that Kubernetes control plane components—such as the API server, scheduler, controller manager, and etcd—are resource-intensive, I allocated more CPU and memory to the master node. The resources were distributed as follows, dedicating a substantial portion of the host’s resources to the cluster to ensure stable overhead for the management plane and stateful workloads:
- Master LXD VM: 7 CPU, 16 GiB RAM, disk size 100 GiB
- Worker LXD VM 1: 5 CPU, 12 GiB RAM, disk size 80 GiB
- Worker LXD VM 2: 5 CPU, 12 GiB RAM, disk size 80 GiB
Similar to the local development setup, I implemented a suite of Makefile targets to ensure consistent and reliable management of QA cluster operations:
qa-nodes-create– Creates three LXD VMs (one master, two workers).qa-nodes-suspend– Pauses all QA VMs.qa-nodes-resume– Resumes suspended VMs.qa-nodes-snapshot– Creates snapshots for backup or rollback.qa-nodes-snapshots-list– Lists existing snapshots.qa-nodes-restore– Restores VMs from a snapshot.qa-nodes-delete– Deletes all QA VMs and snapshots.
These targets elegantly wrap underlying lxc commands and scripts to automate the lifecycle of QA
cluster nodes. Because provisioning and deploying QA environments can be time-consuming,
qa-nodes-snapshot and qa-nodes-restore targets are particularly valuable for quick backups,
rollbacks, and recovery, proving themselves real time-savers.
Before deploying the K3s cluster on these VMs, proper configuration of the host system’s firewall and
network routing is essential. Kubernetes networking relies on the host’s ability to forward packets
between interfaces for pod-to-pod and external communication. Many Linux distributions default to
dropping forwarded packets, which blocks this traffic. Setting the iptables FORWARD chain policy to
ACCEPT resolves this issue. Detailed instructions are provided in
the “Prerequisites”
section of the “Base Cluster How-To’s” guide.
Following the creation of VMs, the K3s-based cluster can be deployed with the qa-cluster-create
and qa-cluster-pull-kubeconfig Makefile targets.
The cluster automatically includes essential add-ons such as DNS, ingress, and storage. The second
target updates the kubeconfig file with the master’s IP address, adjusts context names for clarity,
and merges the configuration into the host’s default kubeconfig, enabling direct local access to the
QA cluster.
All steps required to create and manage the QA cluster are thoroughly described in the “QA” section of the “Base Cluster How-To’s” guide. The cluster has been rigorously tested to ensure it’s fully functional and ready to host workloads that require persistent storage and ingress routing from the outset. Detailed testing notes can be found in the ticket titled “Phase 1: [1A] Provision local dev and QA Kubernetes clusters”.
Deployment Strategy: Adopting Operators and Kustomize
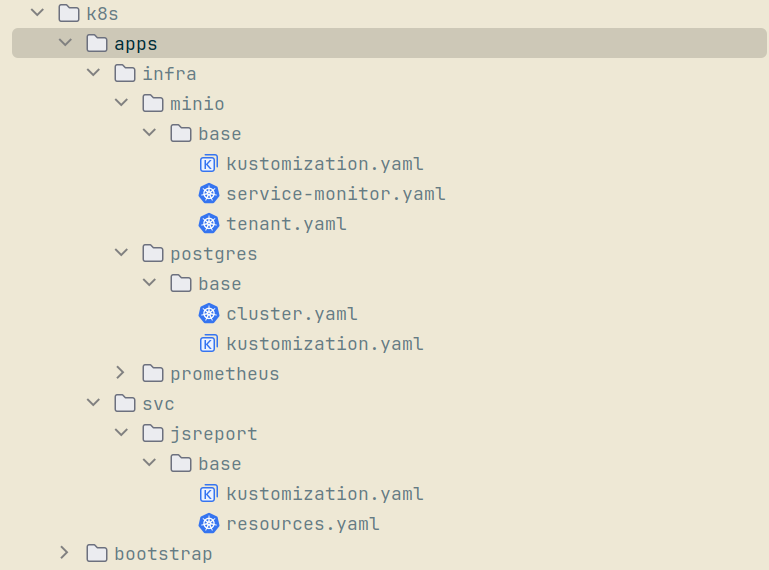
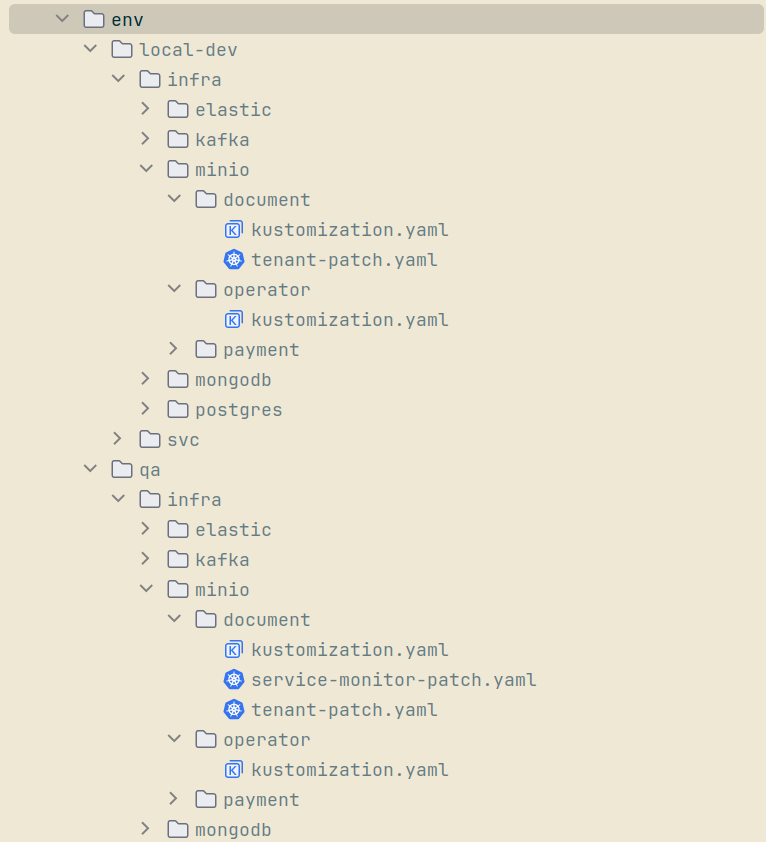
The recommended deployment approach for the Insurance Hub leverages Kubernetes Operators in conjunction with Kustomize overlays for all infrastructure components, including PostgreSQL, MongoDB, Kafka, Elasticsearch, and MinIO. Operators are invaluable for managing the lifecycle and configuration of these stateful services, while Kustomize enables modular overlays and environment-specific customization. In contrast, Java and subsequently Go microservices are deployed using Kustomize alone, which provides flexible resource patching and declarative management without the added complexity of operator logic. This model is directly reflected in the project’s directory structure for both local development and QA environments, as illustrated below in the foldable “k8s Directory Structure” section.
While Helm charts from Bitnami were initially considered for stateful workloads, the discontinuation of free chart support by Bitnami prompted a transition toward Operators for service management. Operators offer distinct advantages over traditional Helm approaches:
- They automate day-2 operations far beyond initial deployment—such as backups, automated failover, upgrades, and scaling—using Custom Resource Definitions (CRDs) that are fully declarative.
- Operators integrate tightly with Kubernetes events and status management, allowing real-time reconciliation and sophisticated self-healing, which is critical for stateful systems.
- Kustomize complements Operators by enabling environment-specific overlays, resource customization, and modular manifest management without relying on custom templating logic. This makes the infrastructure code significantly easier to reason about, review, and modify.
All stateful infrastructure directories (for example, infra/minio, infra/postgres) contain both
Operator-specific manifest files and Kustomize overlays to handle different environments and patches.
Namespace isolation is strictly enforced in the QA environment to simulate production-grade
multi-tenancy and security boundaries. By separating resources into functional namespaces for services
(qa-svc), data (qa-data), authentication (qa-auth), networking (qa-networking), and monitoring
(qa-monitoring), we can effectively limit the blast radius of any issues, simplify access
permissions, and streamline troubleshooting.
qa-svc– Hosts Java/Go microservices, including JSReport.qa-data– Manages PostgreSQL, MongoDB, Elasticsearch, Kafka, MinIO, and TarantoolDB.qa-auth– Dedicated to KeyCloak.qa-networking– Contains Envoy Proxy.qa-monitoring– Houses Prometheus, Grafana, Loki, and Tempo.qa-minio-<tenant-name>– Allocates one MinIO tenant per a dedicated namespace.
This level of separation is intentionally not applied to local development, where resources reside in a
flat local-dev-all namespace for maximum speed and simplicity.
In both environments, Operator manifests and Kustomize overlays reside side by side in well-organized
directories. For example, base/cluster.yaml and base/kustomization.yaml are located together for PostgreSQL
stateful service, allowing for both declarative deployment and environment-specific customization. Patches
for resource adjustments, monitoring endpoints, or multi-tenant configurations are managed through
Kustomize overlays, ensuring repeatable and reliable deployments across local and QA clusters, as shown
below.
k8s Directory Structure
This hybrid deployment strategy achieves several key objectives: automating infrastructure management, simplifying resource customization, enhancing production-like isolation, and facilitating seamless upgrades and scaling as our environments evolve.
Stack Observability: Implementing Metrics and Tracing
Prometheus & Grafana
Observability is fundamental for maintaining, troubleshooting, and optimizing modern distributed systems. In our QA cluster, a robust observability stack provides essential visibility into service health, resource usage, and application performance. The stack deployed here includes Prometheus for monitoring, Grafana for visualization, and Alertmanager for notifications, all managed as a unified bundle via the Kube Prometheus Stack Helm chart.
To automate provisioning and management, I developed a dedicated suite of Makefile targets that supports every stage of the monitoring lifecycle in the QA environment:
prometheus-stack-install– Installs the Kube Prometheus Stack in theqa-monitoringnamespace using Helm, applying a specific chart version and tailored settings from the values.yaml.prometheus-stack-uninstall– Cleanly removes the entire monitoring stack from the cluster.prometheus-stack-status– Displays current status for all key parts of the observability stack.prometheus-ui– Provides local access to the Prometheus web UI via port-forwarding.grafana-ui– Provides local access to the Grafana UI via port-forwarding.
Each target is designed for reliability, repeatability, and ease of use, making routine operations and troubleshooting significantly more efficient. Comprehensive instructions for setting up and managing the observability stack can be found in the “Prometheus & Grafana” section of the “Cluster Apps How-To’s” guide.
Zipkin
Zipkin provides crucial distributed tracing capabilities in the QA Kubernetes cluster during Phase 1. Recognizing that Zipkin is set to be replaced by Grafana Tempo in the next phase, I deployed it using the official Zipkin Helm chart—favoring simplicity over a full Kubernetes Operator given its temporary role—streamlining setup while maintaining required functionality. For efficient storage and trace retrieval, Zipkin is configured to use our existing Elasticsearch cluster as its backend, with dedicated service accounts created to enforce secure, minimal-privilege access.
A focused set of Makefile targets automates Zipkin operations in the QA environment:
zipkin-es-user-secret-create– Creates or updates the secret for Zipkin’s Elasticsearch user credentials.zipkin-es-user-create– Automates the creation of the Elasticsearch role and user for Zipkin via in-cluster test pods.zipkin-install– Installs Zipkin using the Helm chart in theqa-monitoringnamespace, applies custom values, and turns off unnecessary readiness probes to enable a smoother rollout.zipkin-uninstall– Removes Zipkin from the QA cluster completely.zipkin-status– Reports current deployment, pod, service, and endpoint status for Zipkin.zipkin-ui– Enables local port-forwarding for easy access to the Zipkin web UI.
Clear, incremental instructions for deployment and lifecycle management are provided in the “QA-Observability/Zipkin” section of the “Cluster Apps How-To’s” manual. For connectivity and operational validation—including submitting traces through the HTTP API and verifying them in the Zipkin UI—refer to the “Verify Zipkin Deployment and Tracing in QA” guide. This ensures trace functionality is robust and ready for legacy service migration.
Data Infrastructure: Provisioning Stateful Services
PostgreSQL
A reliable and maintainable PostgreSQL deployment is essential for supporting stateful microservices across both QA and local environments. The initial setup used Bitnami’s Helm chart to provision a shared PostgreSQL cluster for all Java microservices. After Bitnami discontinued free support, our deployment strategy evolved to embrace CloudNativePG—a Kubernetes-native Operator meticulously designed for production-grade PostgreSQL management.
To align with best practices described in resources such as “Maximizing Microservice Databases with Kubernetes, Postgres, and CloudNativePG” and the “CNCF Data on Kubernetes Whitepaper”, the updated setup provisions a dedicated PostgreSQL cluster for each Java microservice (payment, policy, product, auth, and document), totaling five clusters per environment. This approach isolates workloads, simplifies scaling, and aligns seamlessly with modern microservice architecture patterns. All configuration is managed through environment-specific Kustomize overlays, which streamline operations and enable easy adjustments when needed.
A suite of Makefile targets smooths every step of the PostgreSQL deployment lifecycle:
postgres-operator-deploy– Deploys the CloudNativePG Operator in thecnpg-systemnamespace.postgres-operator-delete– Removes the Operator and its resources.postgres-svc-secret-create– Creates or updates the service user credentials secret for each database, ensuring secure access.postgres-svc-deploy– Deploys a PostgreSQL cluster tailored for a specific service.postgres-svc-status– Reports the operational status of deployed clusters.postgres-svc-delete– Deletes a specific PostgreSQL cluster.postgres-svc-purge– Completely removes a cluster and its related secrets.
These targets make it easy to provision, update, monitor, or remove Postgres clusters for any service. Detailed instructions for deploying and managing PostgreSQL clusters are available in the “Data/PostgreSQL” section of the “Cluster Apps How-To’s” guide. For QA, Prometheus metrics and Grafana dashboards have been enabled for each service-specific cluster, giving clear visibility into CPU, memory, storage, and network usage.
Connectivity for each cluster is validated using port-forwarding in local development and from test pods in an alternate namespace in the QA environment. Results and troubleshooting guides are documented in “Verify PostgreSQL Connectivity”, ensuring each database cluster is both accessible and production-ready.
MongoDB
MongoDB was deployed using the MongoDB Community Operator to serve as a temporary legacy database during our migration to Go microservices. This setup is intentionally minimal, featuring no monitoring, high availability, or replica sets, and only a single standalone instance—reflecting MongoDB’s short expected lifespan within this project. Resource requests are kept low, with each instance attached to a single PersistentVolumeClaim. There was no need to configure secrets for custom users or complex parameters for either QA or local development.
A dedicated suite of Makefile targets manages every step of the MongoDB deployment process:
mongodb-operator-install– Installs the MongoDB Community Operator in theqa-datanamespace.mongodb-operator-uninstall– Uninstalls the operator and cleans up its resources.mongodb-root-user-secret-create– Creates or updates the root user credentials secret.mongodb-deploy– Deploys a single MongoDBCommunity resource from the manifest with minimal settings.mongodb-status– Shows the current status of MongoDB pods, services, PVCs, and StatefulSets.mongodb-delete– Removes the MongoDBCommunity instance, leaving PVCs and secrets in place.mongodb-purge– Completely purges MongoDB clusters, related PVCs, and associated secrets.
These targets make routine operations simple, consistent, and repeatable. Comprehensive instructions for deploying and managing MongoDB clusters are available in the “Data/MongoDB” section of the “Cluster Apps How-To’s” guide. Cluster connectivity is confirmed by port-forwarding in the local development environment and by connecting from a test pod in a different namespace for QA. Troubleshooting steps and validation advice are provided in the “Verify MongoDB Connectivity” guide, ensuring each deployment is accessible and ready to serve its transitional purpose.
Elasticsearch
Elasticsearch powers the search functionality within the Insurance Hub. For its deployment, I chose the official Elastic Cloud on Kubernetes(ECK) Operator, which provides a production-ready foundation supporting high availability, multi-node clustering, and persistent storage as project requirements evolve. The configuration is HA-capable and deploys topologies that can be expanded to multiple nodes if needed, consistent with best practices for scalable search infrastructure.
Monitoring and observability in the QA environment leverage both the Kube Prometheus Stack and the dedicated Prometheus Elasticsearch exporter, which is deployed separately. This exporter makes Elasticsearch metrics readily available for collection, ensuring deep visibility into cluster health, performance, and usage patterns.
A suite of Makefile targets enables seamless management of the Elasticsearch deployment lifecycle:
es-operator-deploy– Installs the ECK Operator in theelastic-systemnamespace.es-operator-delete– Removes the ECK Operator and its resources.es-deploy– Deploys the Elasticsearch cluster into the target namespace with persistent storage and HA-ready topology.es-status– Displays current cluster status, including pods, PVCs, services, StatefulSets, and custom resources.es-delete– Deletes the Elasticsearch cluster while optionally preserving related resources.es-purge– Entirely removes the cluster, associated secrets, and PVCs, ensuring a clean environment for redeployment.es-exporter-deploy– Deploys the Prometheus Elasticsearch exporter for monitoring metrics.es-exporter-delete– Removes the Elasticsearch exporter deployment.
These targets ensure that every step, from installation to monitoring and teardown, is consistent and repeatable across both local and QA environments. Deployment and management instructions are provided in the “Data/Elasticsearch” section of the “Cluster Apps How-To’s” guide. Connectivity validation and troubleshooting steps are described in the “Verify Elasticsearch Connectivity” guide, ensuring the cluster is operational and ready for search workloads.
Kafka
Kafka plays a central role in enabling event-driven communication between services in the Insurance Hub. For cluster orchestration and lifecycle management, the Strimzi Kafka Operator was selected. Strimzi automates every stage of Kafka deployment, from initial setup through rolling upgrades, scaling, monitoring, and teardown, using Kubernetes-native custom resource definitions for brokers, topics, users, and other key components. This declarative approach significantly simplifies cluster administration and integrates tightly with the underlying Kubernetes API.
In the QA environment, monitoring and observability are expertly handled through Strimzi’s built-in Metrics Reporter, which works seamlessly with the Kube Prometheus Stack. Exported metrics are visualized in Grafana dashboards, offering clear insight into cluster health and performance.
A comprehensive suite of Makefile targets supports Kafka operations across both local dev and QA clusters:
kafka-strimzi-operator-install– Installs the Strimzi Kafka Operator in thekafka-systemnamespace.kafka-strimzi-operator-uninstall– Uninstalls the Operator and deletes thekafka-systemnamespace.kafka-deploy– Deploys a Kafka cluster in the target namespace, including brokers and supporting services.kafka-status– Displays current Kafka resources, including brokers, pods, services, PVCs, and StrimziPodSets.kafka-delete– Removes the Kafka cluster, preserving PVCs and StrimziPodSets for potential recovery.kafka-purge– Fully deletes the Kafka cluster along with all related NodePools, PVCs, and StrimziPodSets.kafka-topics-list– Lists all Kafka topics managed by the cluster.kafka-console-producer– Launches an interactive Kafka console producer pod for sending messages to a specified topic.kafka-console-consumer– Launches a console consumer pod to read messages from a specified topic.
These automation targets ensure repeatable, reliable operations from initial deployment to final teardown and validation. Complete step-by-step instructions for cluster setup and management are provided in the “Data/Kafka” section of the “Cluster Apps How-To’s” guide. Connectivity and functional validation—including producing and consuming test messages on dedicated topics—can be found in the “Verify Kafka Producer/Consumer” guide, ensuring that the deployed cluster is ready for robust, production-like messaging workloads.
MinIO
MinIO effectively replaces our legacy filesystem storage for Java services, providing S3-compatible object storage tailored for both local development and production-like QA needs. Deployment utilizes the official MinIO Kubernetes Operator in combination with Kustomize manifests and overlays for tenant deployments, delivering flexibility and automation across diverse environments.
Consistent with Kubernetes multi-tenancy best practices, each MinIO Tenant is deployed within its own dedicated namespace. This strategy enforces resource isolation, prevents configuration conflicts, and cleanly separates object storage workloads. For local development, a single-node tenant is sufficient, while a three-node high-availability tenant is provisioned for QA, matching requirements for durability and scalability.
A designated suite of Makefile targets supports all stages of MinIO lifecycle management:
minio-operator-deploy- Deploys the MinIO Operator in theminio-operatornamespace.minio-operator-delete- Removes the Operator and associated resources.minio-storage-user-secret-create- Creates or updates user credentials secrets for each tenant namespace.minio-storage-config-secret-create- Manages configuration secrets for secure tenant setup.minio-tenant-deploy- Deploys a MinIO tenant cluster for a given service within a dedicated namespace, with overlays for local dev and QA topologies.minio-tenant-status- Shows operational status, listing pods, services, PVCs, and ServiceMonitors for any tenant.minio-tenant-delete- Deletes a selected MinIO tenant cluster along with monitoring resources.minio-tenant-purge- Fully deletes a tenant, all related secrets, PVCs, and its namespace.
These automation targets streamline deployments, upgrades, and teardowns, ensuring reliable, repeatable operations across all environments. Incremental instructions are available in the “Data/MinIO” section of the “Cluster Apps How-To’s” manual. For validation, connectivity tests, and bucket management tasks—such as creating, listing, and deleting buckets using the mc MinIO client—are described in the “Verify MinIO Connectivity” guide, ensuring MinIO tenants are production-ready for object storage operations.
Legacy Support: Hosting Supplemental Services
jsreport
jsreport provides essential PDF generation capabilities for the Insurance Hub’s document service during Phase 1. Recognizing that this function is scheduled to be replaced by the chromedp library as part of the Phase 4 migration to Go, jsreport is deployed as a single-node instance in both local development and QA environments. Deployment is handled using standard Kubernetes manifests, with Kustomize base and overlays providing environment-specific customization. This setup prioritizes simplicity, operational reliability, and a minimum resource footprint for its temporary role.
A concise suite of Makefile targets supports jsreport lifecycle management:
jsreport-deploy– Installs jsreport in the designated service namespace using Kustomize overlays.jsreport-status– Displays current pod, service, and PVC status in the active namespace.jsreport-delete– Removes jsreport deployment resources from the cluster.jsreport-purge– Deletes the associated persistent volume claim, ensuring full cleanup.jsreport-ui– Enables local port-forwarding for quick access to the jsreport web UI.
Detailed, step-by-step guidance for deployment and management is available in the “Services/jsreport” section of the “Cluster Apps How-To’s” manual. Connectivity and operational validation—including UI access and PDF report generation—are covered in the “Verify jsreport PDF Generation” guide, ensuring jsreport remains production-ready while the migration proceeds.
Platform Validation: Testing and Hardening Foundation
Before finalizing major changes to the Insurance Hub infrastructure, I conducted a focused round of polishing and validation to ensure reliability and maintainability across both local and QA environments. This comprehensive process involved reviewing all previous changes and making necessary adjustments, including updates to manifest organization, Makefile automation, resource configurations, and documentation alignment. For more granular details, please refer to pull request #43.
Every step—from cluster provisioning to infrastructure deployment and application setup—was rigorously revalidated using the latest iterations of the “Base Cluster How-To’s” and “Cluster Apps How-To’s” guides. Each workflow, from cluster bootstrapping to infrastructure component deployment, was retested with step-by-step instructions. Special care was taken to ensure every Makefile target produced its intended outcome, that namespaces and overlays accurately reflected the current platform architecture, and that connectivity, health, and resource checks for all components were consistently successful.
This systematic validation process guarantees platform robustness, prevents regression, and provides clear, up-to-date operational guidance. With this solid foundation firmly in place, the Insurance Hub is now ready for the next stage of migration and the integration of additional cloud-native features and automation.
AI Assistance: Engineering with Augmented Workflows
In my previous article, I described my approach to AI tools as advanced research aids—something akin to “Stack Overflow on steroids”—that supplement my own coding rather than replace it. However, at the beginning of this migration phase, I experimented with relying heavily on AI to implement everything. This approach, I quickly learned, backfired precisely because my foundational knowledge of Kubernetes was limited. Crafting effective prompts, it turns out, requires at least a basic understanding of the subject matter. Initially, most AI-generated results were incorrect or did not work as intended, leading to time-consuming back-and-forth troubleshooting with the AI tools. As I progressed through deploying various components, I consciously shifted my focus toward proactively learning the topics involved—such as identifying appropriate Kubernetes operators and meticulously studying documentation. This growing expertise helped me significantly reduce unproductive AI interactions and obtain more accurate results. Despite these initial challenges, AI still proved invaluable for debugging particularly tricky issues.
Here is how I effectively used AI tools during this step:
- Generating incremental, detailed GitHub issues aligned with the finalized project scope, using a consistent ticket template for clarity.
- Automating Makefile targets for cluster provisioning, infrastructure deployment, observability stack management, and lifecycle operations.
- Creating Kubernetes manifests, Kustomize overlays, and resource configurations for both local (Kind) and production-like QA (K3s) clusters.
- Applying Kubernetes best practices, such as namespace isolation, operator-based management of stateful services (PostgreSQL, Kafka, MinIO, Elasticsearch), and strategically combining Operators with Kustomize overlays for deployment.
- Drafting structured documentation for cluster provisioning, observability setup (Prometheus, Grafana, Zipkin), and troubleshooting.
- Facilitating connectivity validation and health checks for stateful services using port-forwarding and test pods to ensure production readiness.
My primary AI tools were JetBrains AI Assistant (AI Pro plan, US $100/year) and Perplexity (Perplexity Pro plan, US $200/year). Comparing their usage limits highlights essential contrasts. Although Perplexity costs twice as much annually, its usage allowance is much more generous, enabling longer and more complex sessions without quickly hitting limits. JetBrains, on the other hand, starts with just 10 AI credits every 30 days, which are easily exhausted—especially when using resource-intensive models like Claude Sonnet or ChatGPT. This significantly limits how freely one can interact with the tool, with just a few demanding coding tasks potentially consuming the entire month’s quota.
JetBrains’ main advantage lies in its tight integration with IntelliJ IDEA, embedding AI directly within the IDE workflow for smooth, immediate coding assistance. However, this convenience comes with trade-offs: JetBrains’ Junie coding agent consumes credits rapidly, intensifying the sense of limited usage. Furthermore, JetBrains has recently imposed stricter limits, reducing overall quotas and necessitating even more cautious credit management. This contrasts sharply with Perplexity’s more open usage model, which better suits heavier or more exploratory AI interactions despite its higher price tag.
Lift Work: Closing Thoughts
This article has covered the initial, critical portion of Phase 1 in the Insurance Hub migration journey: the “lift” phase. During this stage, my focus was squarely on migrating the entire legacy environment as-is from Docker Compose to production-like Kubernetes clusters. This involved diligently provisioning local and QA environments, deploying core infrastructure components, and establishing robust observability and operational foundations. This foundational work has yielded a stable platform that closely mirrors our target production environment, enabling thorough validation and troubleshooting without disrupting existing workflows.
The upcoming “shift” phase will build directly on this groundwork. It involves targeted code modifications to transition our Java services—such as updating them to use MinIO’s S3-compatible object storage instead of the legacy filesystem—and then containerizing and deploying those services within Kubernetes. Additionally, service discovery will migrate from Consul to Kubernetes-native DNS, streamlining inter-service communication and aligning fully with cloud-native design principles. The existing Java-based API gateway will also be deployed and configured to integrate with the Kubernetes service mesh. Lastly, GitOps automation with tools like ArgoCD or Flux will be introduced, enabling declarative, version-controlled CI/CD pipelines for reliable, auditable deployments.
This phased “Lift and Shift” approach expertly balances migration speed with operational continuity, all while meticulously setting the stage for deeper optimizations and the eventual migration to Go in later phases. Stay tuned for the next article, where the focus will shift to these code-level modernizations, container deployments, and advanced automation strategies—key steps in unlocking the full benefits of Kubernetes for the Insurance Hub.
Continue reading the series “Insurance Hub: The Way to Go”: